| Previous :: Next Topic |
| Author |
Message |
peltoms
Member


Joined: 13 Jul 2006
Posts: 1760 | TRs | Pics
Location: Worcester MA |
|
peltoms
Member
|
 Sat Aug 31, 2013 11:26 am |
|
|
The 2013 winter season provided close to average snowpack in the North Cascades as indicated by the average SWE at SNOtel stations in the range. The summer melt season has proved to be long, warm and dry. The May-August mean temperature at the station closest to a glacier, Lyman Lake, has been tied for the 2nd warmest in the last 25 years with 2009, and only 2004 warmer. The summer has lacked record periods of warmth and has featured sustained warm temperatures and higher than average humidity, reducing the number of nights when the glacier surface has frozen. The average minimum temperatures at Lyman Lake was the highest in the last 25 years for July and August.
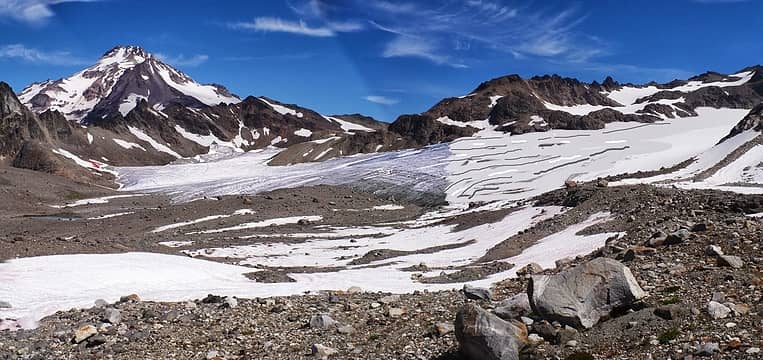
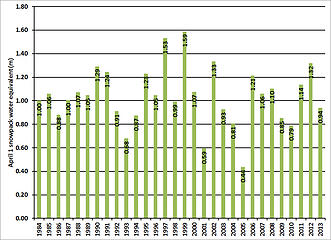 April 1 SWE at Snotel sites in North Cascades  Columbia Glacier on Aug. 18 original taken by NWhiker Stefan-K  Columbia Glacier on Aug. 1  Columbia Glacier terminus 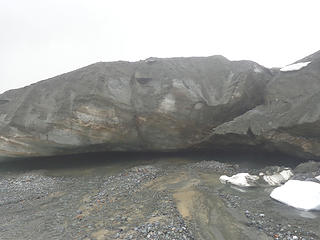 Columbia Glacier terminus 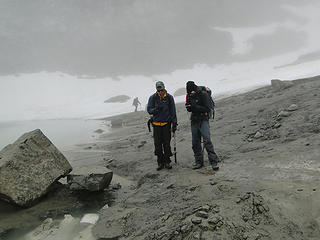 Surevying terminus of Columbia Glacier 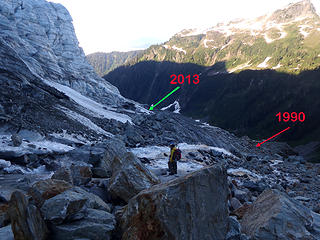 Terminus retreat Lower Curtis Glacier 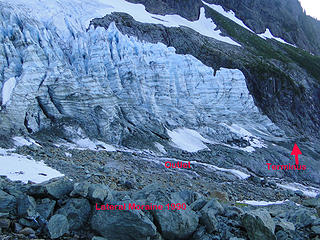 Terminus of Lower Curtis Glacier 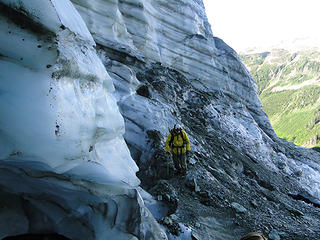 Matt Holland at terminus of Lower Curtis Glacier 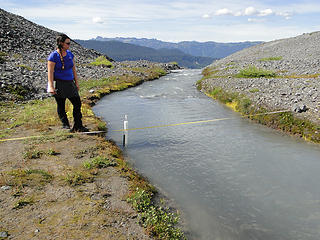 Stream flow gage below Sholes Glacier 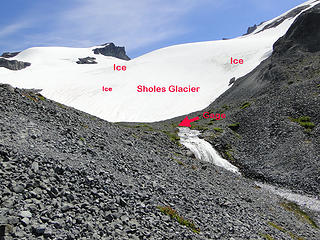 Stream flowing measuring location below Sholes Glacier 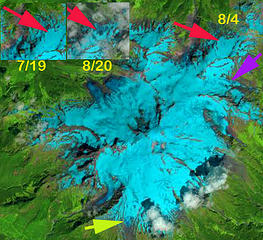 Landsat images of Mount Baker and Sholes Glacier 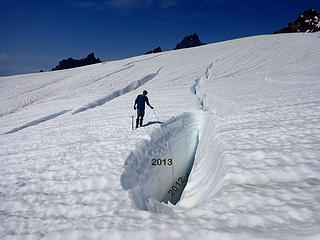 Easton Glacier snow depth 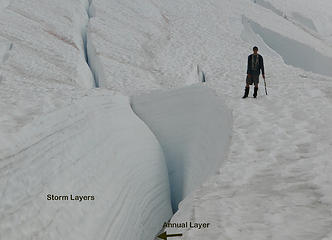 Stratigraphy at 200 m on Easton Glacier 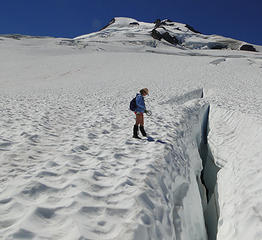 Measuring total crevasse depth with cam line. 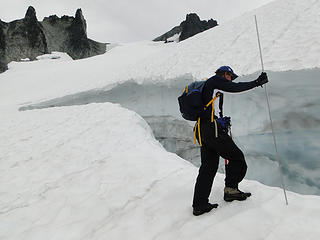 Probing for crevasse 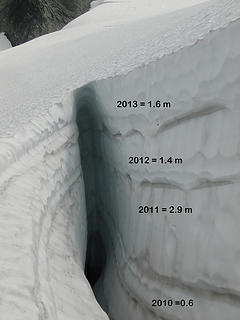 Snow depths in crevasse on Lynch Glacier 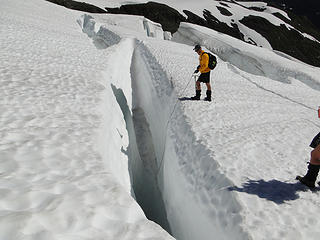 Measuring snow depth in crevasse on Rainbow Glacier 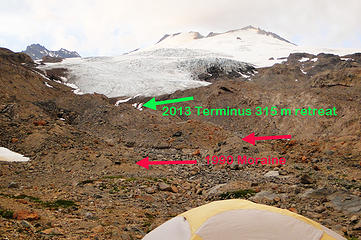 Retreat of Easton Glacier 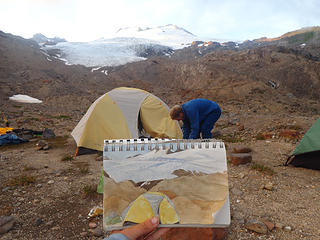 Sketch of Easton Glacier camp by Jill Pelto 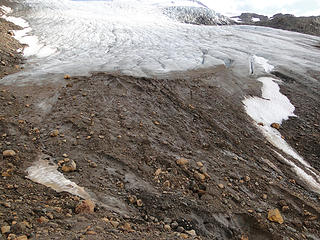 Easton Glacier terminus 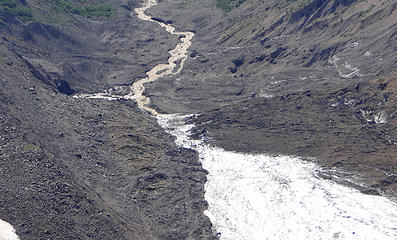 Deming Glacier from above 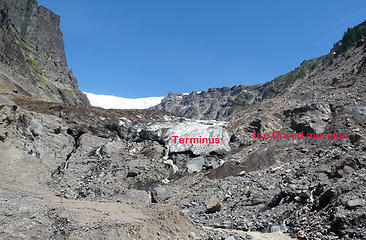 David Tucker image of terminus of Deming Glacier 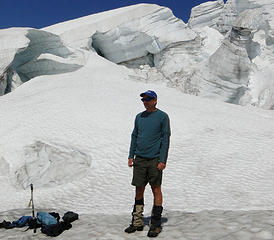 Amidst Eastson Glacier icefall 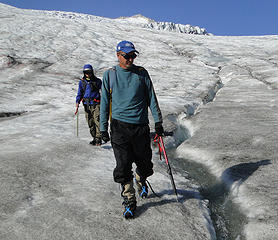 Easton Glacier near terminus 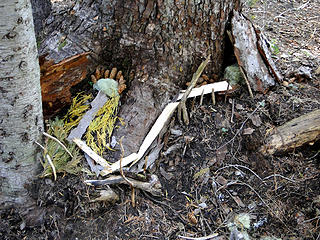 Squaw Lake Fairy house Snow depths in crevasse on Lynch Glacier 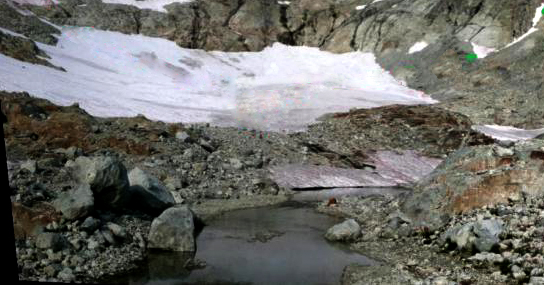 Ice Worm Glacier on 8/21 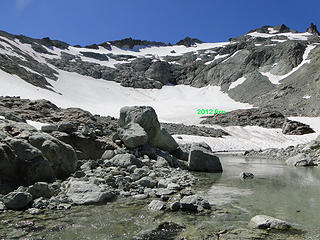 Ice Worm Glacier runoff 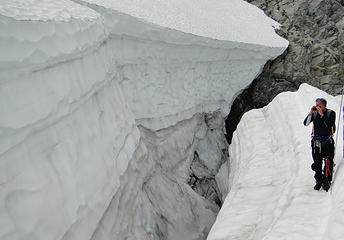 Crevasse on Lynch Glacier
|
| Back to top |
  
|
|
gb
Member

Joined: 01 Jul 2010
Posts: 6310 | TRs | Pics
|
|
gb
Member
|
Sat Aug 31, 2013 11:45 am |
|
|
The NWS Seattle has monthly graphs showing that Sea Tac has been above normal since the latter half of April. Nighttime temperatures have been especially so. http://www.wrh.noaa.gov/climate/temp_graphs.php?stn=KSEA&wfo=sew
But it seems to me that freezing levels have been even more dramatically warm, with the majority of the summer at 13500' to 14500'. Are there any weather records that show average freezing levels for this summer as compared to normal?
|
| Back to top |
|
|
peltoms
Member
Joined: 13 Jul 2006
Posts: 1760 | TRs | Pics
Location: Worcester MA |
|
peltoms
Member
|
Sun Sep 01, 2013 3:30 am |
|
|
Since freezing levels are forecast and not measured, I am not aware of a record. The Camp Muir temperature record would be pretty good though. I will wait for more a detailed look until September ends.
|
| Back to top |
|
|
lopper
off-route
Joined: 22 Jan 2002
Posts: 845 | TRs | Pics
|
|
lopper
off-route
|
Sun Sep 01, 2013 4:38 am |
|
|
Thank you for another year's collection of glacier data and images.
|
| Back to top |
|
|
puzzlr
Mid Fork Rocks

Joined: 13 Feb 2007
Posts: 7220 | TRs | Pics
Location: Stuck in the middle |
|
puzzlr
Mid Fork Rocks
|
Sun Sep 01, 2013 11:27 am |
|
|
I really enjoy reading these reports-with-pictures. I don't think I could make it through the journal articles! This year I learned about "Storm Layers", which answers some questions I've had about why some layers I thought were annual were so thin!
|
| Back to top |
|
|
Jetlag
Member
Joined: 17 Aug 2010
Posts: 1410 | TRs | Pics
|
|
Jetlag
Member
|
Sun Sep 01, 2013 5:39 pm |
|
|
I can see that these high nighttime temperatures nourishing my heirloom tomatoes have not been so kind to the glaciers. The last two nights I spent in MRNP were no different - incredibly warm.
|
| Back to top |
|
|
gb
Member
Joined: 01 Jul 2010
Posts: 6310 | TRs | Pics
|
|
gb
Member
|
Sun Sep 01, 2013 10:09 pm |
|
|
| peltoms wrote: | | Since freezing levels are forecast and not measured, I am not aware of a record. |
Actually, freezing levels are measured twice a day at 4 am and 4 pm at Quillayute, Salem, and Spokane. I don't know the exact methodology or whether the data is continuous with elevation or whether point data is collected and interpolated.
Apparently, this methodology began as an Army program:
It won't let me quote it, but here is the link. the methodology is on page 9:
http://www.dtic.mil/cgi-bin/GetTRDoc?AD=ADA365754
Here is the link to the Quillayute current "skew T sounding". As I write this the freezing level is at 640 mb which must be around 13000'.
http://weather.rap.ucar.edu/upper/uil.gif
It would be very interesting to see if there are trends in this data and how it correlates with firn lines.
|
| Back to top |
|
|
peltoms
Member
Joined: 13 Jul 2006
Posts: 1760 | TRs | Pics
Location: Worcester MA |
|
peltoms
Member
|
Mon Sep 02, 2013 4:23 am |
|
|
The upper air soundings in Quillayute are made but how useful is this for Cascade freezing levels? If this was Cle Elum or Monroe that would be good.
|
| Back to top |
|
|
gb
Member
Joined: 01 Jul 2010
Posts: 6310 | TRs | Pics
|
|
gb
Member
|
Mon Sep 02, 2013 7:24 am |
|
|
| peltoms wrote: | | The upper air soundings in Quillayute are made but how useful is this for Cascade freezing levels? If this was Cle Elum or Monroe that would be good. |
I guess it depends on where a ridge of high pressure is centered and how big it is. If anything, for a strong ridge of high pressure that remains stationary, the Quillayute data probably understates Cascade Freezing Levels more often than not.
|
| Back to top |
|
|
George Winters
Member

Joined: 02 Oct 2009
Posts: 217 | TRs | Pics
Location: Darrington |
 Whitechuck Glacier 1986 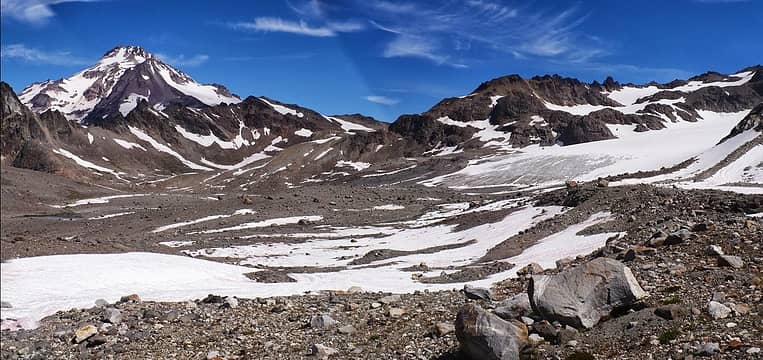 Whitechuck Glacier 2013
When you are "miles from nowhere" you must have finally arrived at somewhere.
When you are "miles from nowhere" you must have finally arrived at somewhere.
|
| Back to top |
|
|
Jetlag
Member
Joined: 17 Aug 2010
Posts: 1410 | TRs | Pics
|
|
Jetlag
Member
|
Mon Sep 02, 2013 11:05 am |
|
|
George, good point about the Whitechuck glacier's amazing retreat. I wish I had saved my pictures from the early 70's. The Honeycomb glacier, just east of the Whitechuck, draining the other side of Kololo, is also impressively shorter but much thicker.
|
| Back to top |
|
|
peltoms
Member
Joined: 13 Jul 2006
Posts: 1760 | TRs | Pics
Location: Worcester MA |
|
peltoms
Member
|
Mon Sep 02, 2013 11:09 am |
|
|
Yes, good old Whitechuck, White River has changed about the same amount. Note the previous work on that we have done.
|
| Back to top |
|
|
peltoms
Member
Joined: 13 Jul 2006
Posts: 1760 | TRs | Pics
Location: Worcester MA |
|
peltoms
Member
|
Tue Sep 03, 2013 5:41 am |
|
|
|
| Back to top |
|
|
gb
Member
Joined: 01 Jul 2010
Posts: 6310 | TRs | Pics
|
|
gb
Member
|
Tue Sep 03, 2013 8:16 am |
|
|
Interesting set of videos.
The video of the Lower Curtis reminds me of old turn of the 19th century photographs of early explorers on the Illecillewaet (called at that time "The Great Glacier"). The glacier still remains but the rounded character of the seracs and many annual lines seem to indicate that not much is happening.
I know you follow Canada, too, as I think I've seen your work on the Columbia Glacier from the Icefield. As warm as this summer has been here, in Canada it has doubtless been without precedent, with average temperatures (from Environment Canada) running probably 3 to 8 degree C above normal the entire summer. Historically, the Canadian Rockies glaciers have survived not on the basis of snowfall, particularly in winter (because winters are pretty dry), but because of cloudy, cool weather that has been the norm for all but a few weeks in the summer. I would think on the high icefields that April, May, June snowfall has been very important. I've followed trip reports from Canada and this one (there are several) from Mt. Ball near Vermillion Pass shows almost no firn remaining on the glaciers at all. http://www.clubtread.com/sforum/topic.asp?TOPIC_ID=57887
It appears obvious that many of these glaciers are not really moving anymore at all, just melting in situ. Crevasses appear to be just old cracks.
Are there many glaciers that you know of in the Cascades that are no longer moving, but just thinning and melting? Or do most still exhibit some movement?
|
| Back to top |
|
|
peltoms
Member
Joined: 13 Jul 2006
Posts: 1760 | TRs | Pics
Location: Worcester MA |
|
peltoms
Member
|
Tue Sep 03, 2013 4:40 pm |
|
|
Most of the glaciers larger than 0.2 square kilometers still move. Glaciers like the Colonial Glacier are exceptions that are larger and do not move. All of the glaciers we work on except Ice Worm Glacier are still moving. Cracks look much different than crevasses, I do not see alot of these.
|
| Back to top |
|
|
|
|


